Facilities of all kinds, from industrial to commercial to large residential, often share a common problem: voltage level and stability. Whether the problem merits troubleshooting depends on the sensitivity of building loads and the degree of voltage variations.
For example, voltage level may become a problem in an area where there are many loads or buildings connected to a common utility connection. In order to maintain the proper voltage at the end of the line, the utility will typically set the voltage above nominal. As loads are added and shed the voltage will fall and rise. This makes it possible for the voltage at the entry to an area to rise more than 10% as loads are shed. And, as loads are added the voltage may decrease more than 10% at the end of the line.

Voltage stability may be a problem in areas where loads are cycling on and off during the day. Large compressors, motors, welding machines, arc furnaces, power factor correction capacitors and other large electrical machinery along with system impedance can easily cause voltage dips, swells, and transients.
In industrial settings, large loads will cause the voltage to fluctuate when they turn on. For example, motors switching on can cause voltage dips and power factor correction capacitors can cause voltage transients. Or, a large arc furnace may cause the voltage to dip when it is started. Or, welding machines may cause transients on the line when used. These issues may cause problems with control systems like P LCs or computers and other office equipment.
Commercial buildings, especially large ones, have their voltage problems too. Air handlers and air conditioning systems are a must for the safety and comfort of the occupants. The problem is that these systems may cause voltage dips or transients as they cycle on and off (especially during periods of high demand). In a high rise office building, increasing loads on lower floors will cause low voltage on upper floors affecting computers, copiers, and other electronic office equipment.
Hospitals today are especially vulnerable to voltage problems. X-ray machines, CT Scanners, radiation therapy equipment, and virtually all of the patient analysis and monitoring equipment is sensitive to voltage problems. Before installation many of these items require confirmation of a stable and correct level of voltage supply. Some of them may also cause voltage problems for other systems, including laboratory and computer and office equipment.
To troubleshoot these issues, a single-phase voltage recorder is often the simplest first step. Set the interval, plug it in to the circuit in question, and let it log. Then, after suspect loads have cycled on and off for a period, download the data and use the software to analyze the voltage supply, as well as look for harmonics, transients, and other potential issues. The following discussion uses the Fluke VR1710 Voltage Recorder to demonstrate that analysis.
Evaluating the circuit to find the problem
Voltage
The Fluke VR1710 provides two easy methods to evaluate voltage stability. The first is voltage graphs.
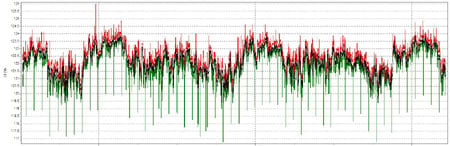
Voltage graphs are a very easy way to quickly evaluate voltage stability and level. For example, in Figure 1, the maximum voltage is 126 V and the minimum is about 116.5 V. Today utilities try to maintain the supply voltage ±5% of a nominal 120 V. An interesting aspect of this view is that the effect of loads cycling on/off is readily visible. Some places where you might see this is where electric motors are cycling, power factor correction capacitors are being inserted or removed from a line, welders are operating, or other large loads are being turned on. Much of this is due to three phase loads that can/will affect single phase voltage stability.
The second method uses statistical analysis to evaluate voltage stability.
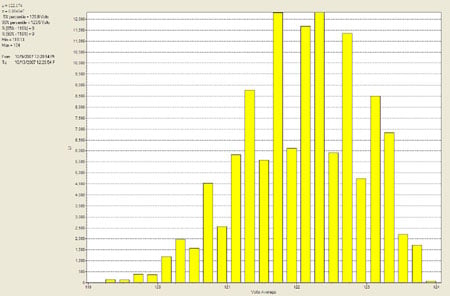
In the Statistical Analysis view, the algebraic mean of the voltage (average),µ, is presented along with the Standard Deviation, ?. As of much interest is the percentile data. The voltages listed are where 5% and 95% of the data occurs below. For example, here 5% of the voltage readings are below 120.8 V and 95% of the voltage readings are below 123.5 V. Another way to look at this is that 90% of the readings were between 120.8 and 123.5 V. The minimum and maximum voltage is shown as well as what percent of the readings are outside of -15% to +10% (85% to 110%) of the nominal voltage and ±10% (90% to 110%) of the nominal voltage.
Harmonics
Harmonics continue to be a concern on the electrical system because of the abundance of electronic devices in use today. In commercial, industrial, and hospital facilities there are computers, environmental controls, manufacturing equipment, laboratory and patient treatment equipment that generally produce harmonics. The harmonics they produce are due to current waveform distortion. Since the utility delivers a relatively clean voltage and the VR1710 does not measure current, what is the value of looking at the voltage harmonics? Well, keep in mind that all electrical systems have a characteristic impedance (resistance) based on wire size and length, connections, circuit protectors, and switching. As loads (currents) increase, voltage drops will occur across this impedance. If these currents are at harmonic frequencies the voltage drops produced will also be at the harmonic frequencies, therefore inducing a harmonic voltage into the electrical system. This voltage distortion can cause problems in computers and other electronics. For example, if the voltage distortion causes the peak voltage at 50 or 60Hz, to decrease it may affect the power supplies in computers and other office equipment causing intermittent operation.
Here is a look at voltage harmonics in a system where the load currents have affected the voltage.
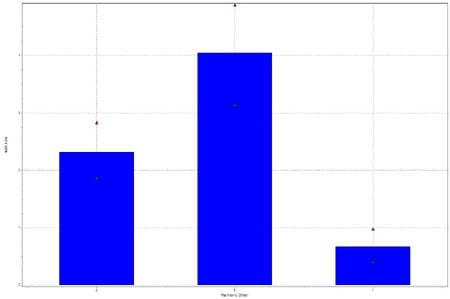
While it is difficult to tell when voltage harmonics will cause a problem, if there are problems, significant voltage harmonics may indicate the need to perform a more comprehensive power quality study. In this case, the analysis should use a power quality analyzer that will evaluate both voltage and current like the Fluke 435.
Flicker
Flicker is described this way: "Flicker is the impression of unsteadiness of visual sensation induced by a light stimulus whose luminance or spectral distribution fluctuates with time." The bottom line is that flickering lights can go from being a mild annoyance to very irritating and even to the point of causing physical symptoms in the observer. Two key parameters of flicker are PST (short-term flicker) and PLT (long-term flicker). PST is measured over a 10 minute interval and the standard recommends a reading below 1.0. PLT is measured over a two hour period and the standard recommends a reading below 0.8.
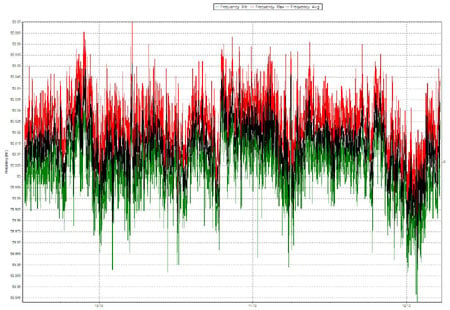
Frequency
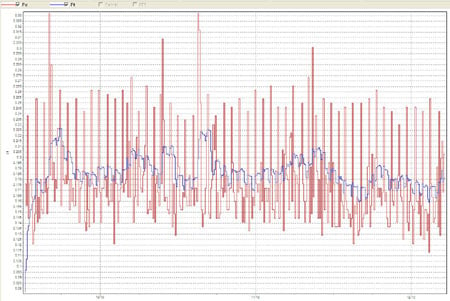
The local utility delivers a stable 50 or 60 Hz, depending on the power frequency. However, what if you are operating off of a generator? Load variations can cause the rpm to change and therefore change frequency output. The Fluke VR1710 Voltage Recorder is an easy way to verify that the generator is properly maintaining its output. Along with frequency, the unit records voltage, dips, and swells as loads change and monitors voltage transients, as well. Below is a frequency graph.
Transients
The mention of transients conjures up lightening strikes somewhere up line. However, there are many other causes ranging from power factor correction capacitors being added to a line to large electric motors to arc welders. The Fluke VR1710 records voltage events as fast as 100 µs with the ac waveform. This makes it easy to see where the event occurred on the waveform, what type of event it was, and its voltage level.
Summary
With the increased sensitivity of electrical loads today, verifying voltage quality has become a necessity. With a leave-behind voltage recorder such as the Fluke VR1710, you can record major voltage parameters, analyze them after the fact with Fluke Power Log software and print a report.